SLB Enterprise Oil Services Platform
Streamlining workflows for a clearer, role-specific experience
00

Problem
As the existing system slowed their working efficiency with inconsistent interactions, unclear workflows, and irrelevant data, we led the effort to streamline the platform to create a clearer, role-specific experience that support cross-functional collaboration and decision-making.
Solution
To address these challenges, I redesigned the platform to focus on clarity and efficiency. The new design introduced streamlined workflows, consistent interaction patterns, and role-specific content, ensuring that each user could improve efficiency, support cross-functional collaboration, and enabled decision-making across organization.
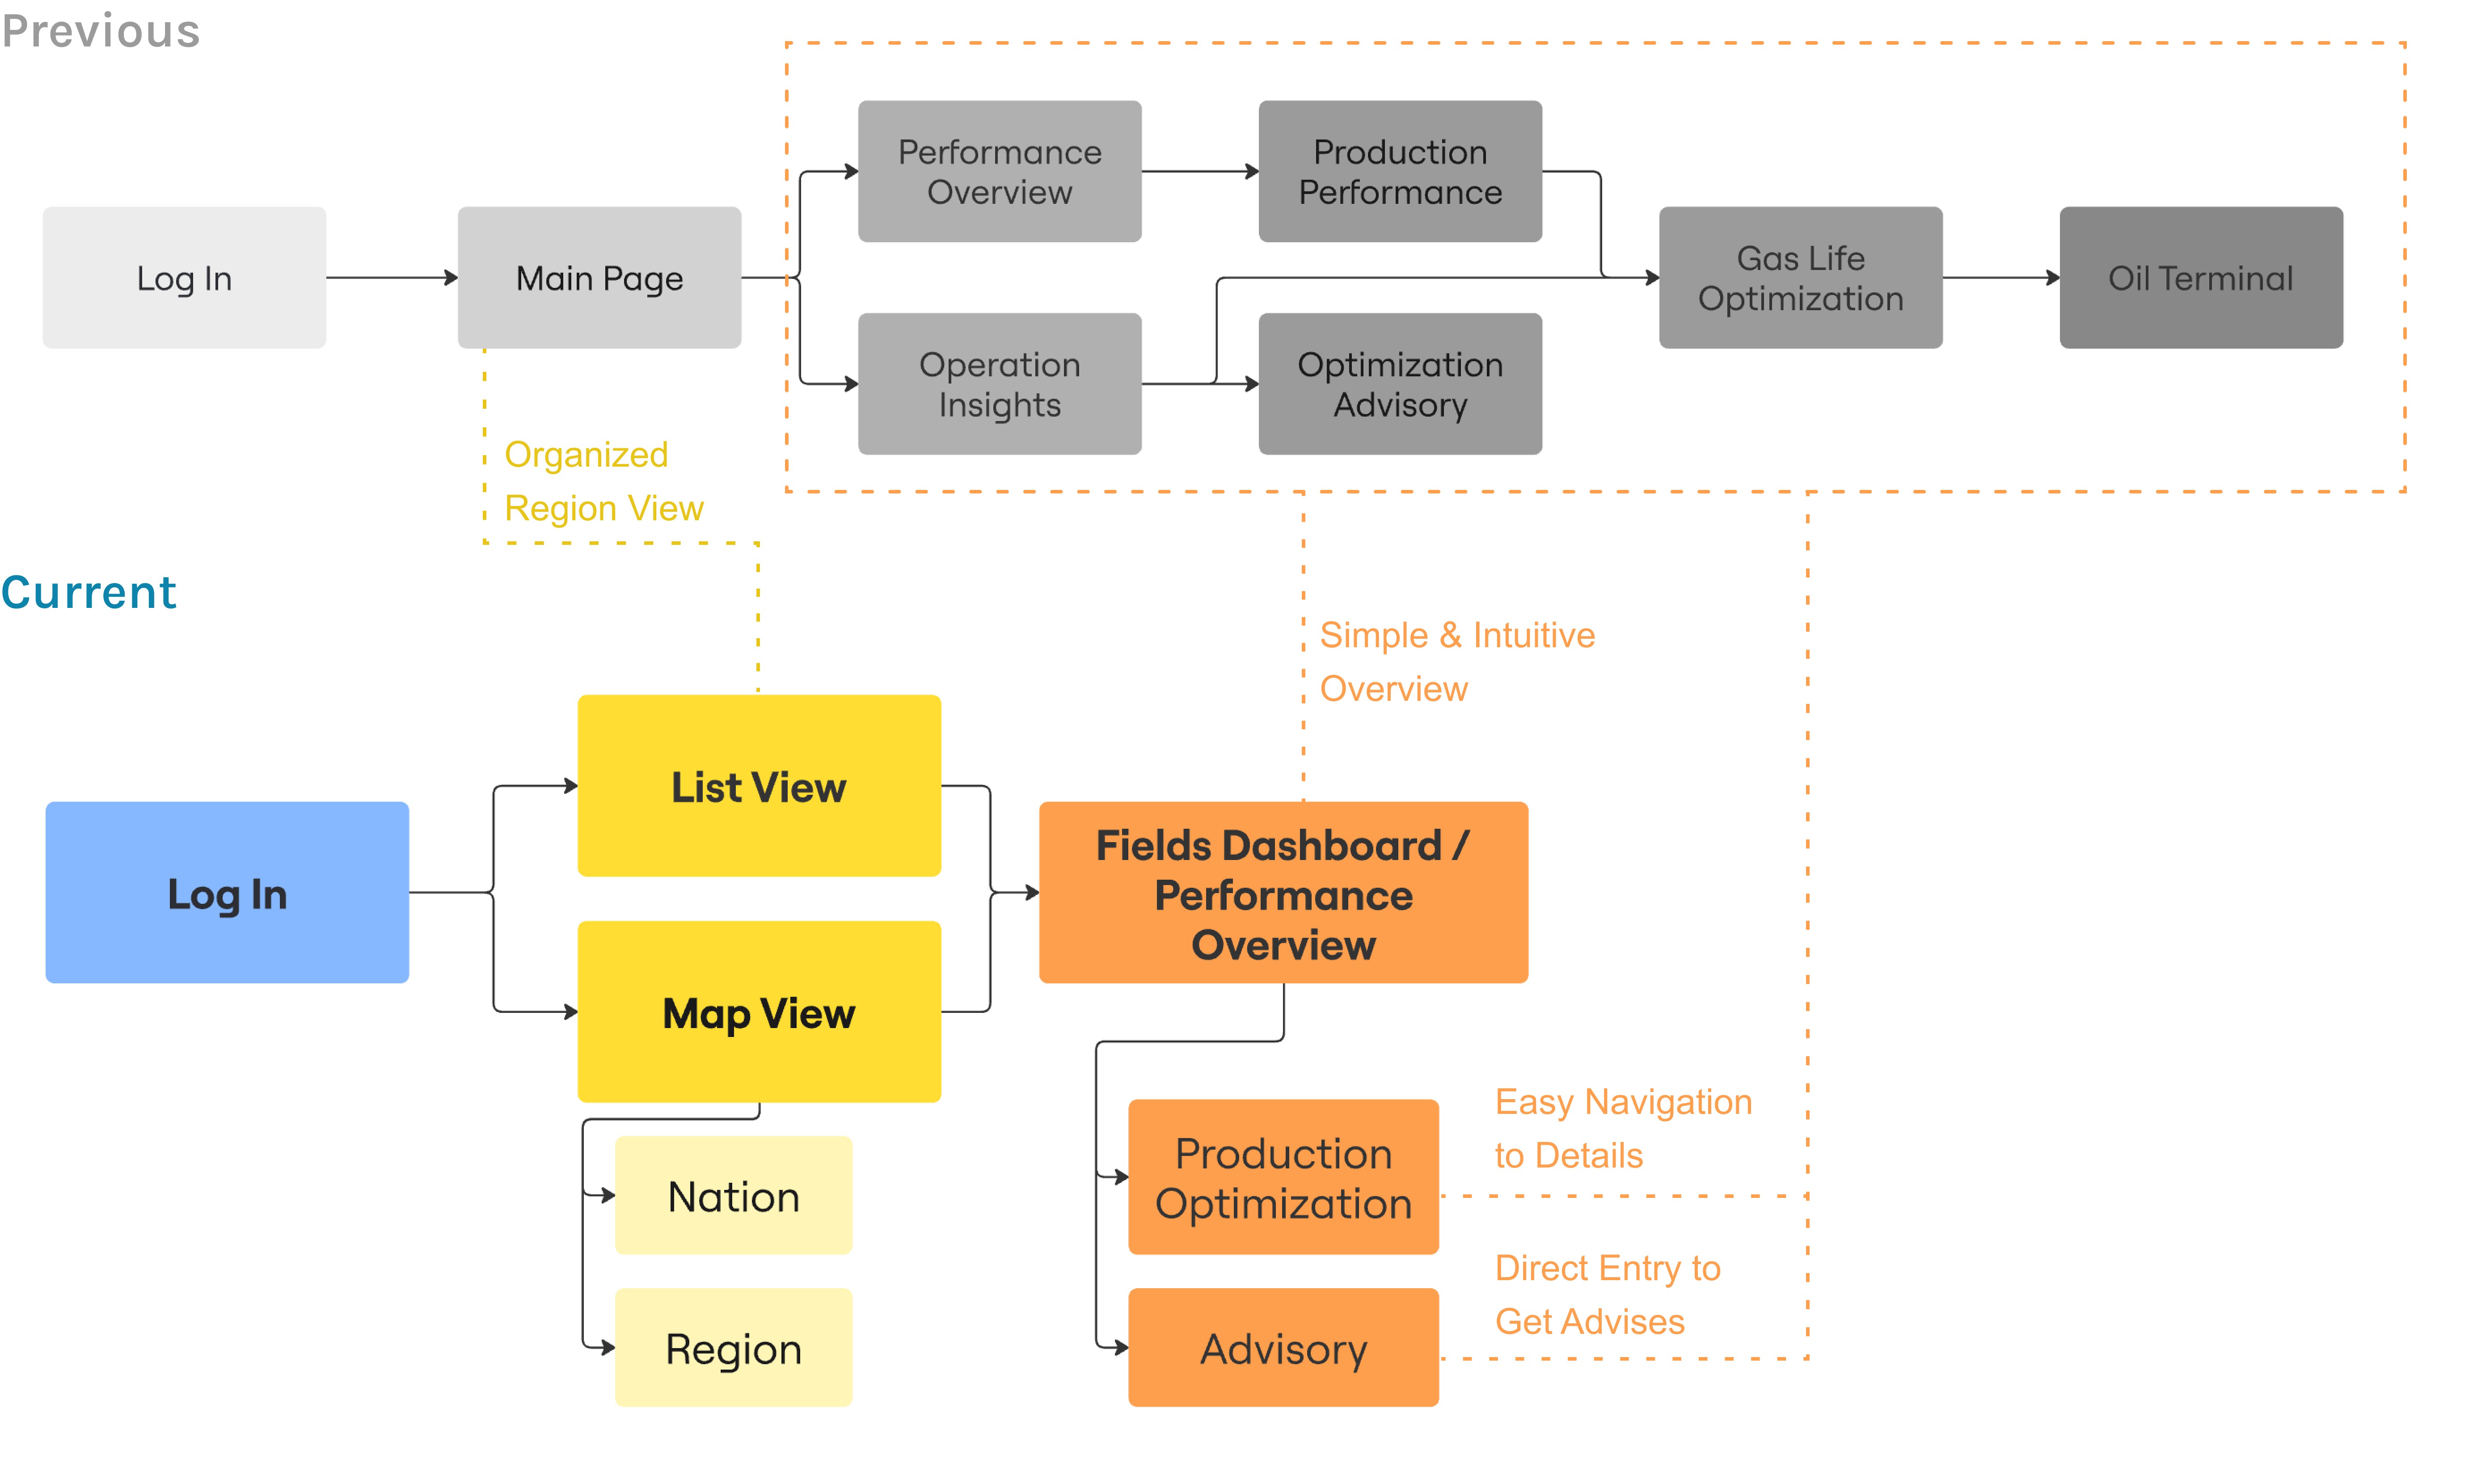
Understanding the Existing System Flow
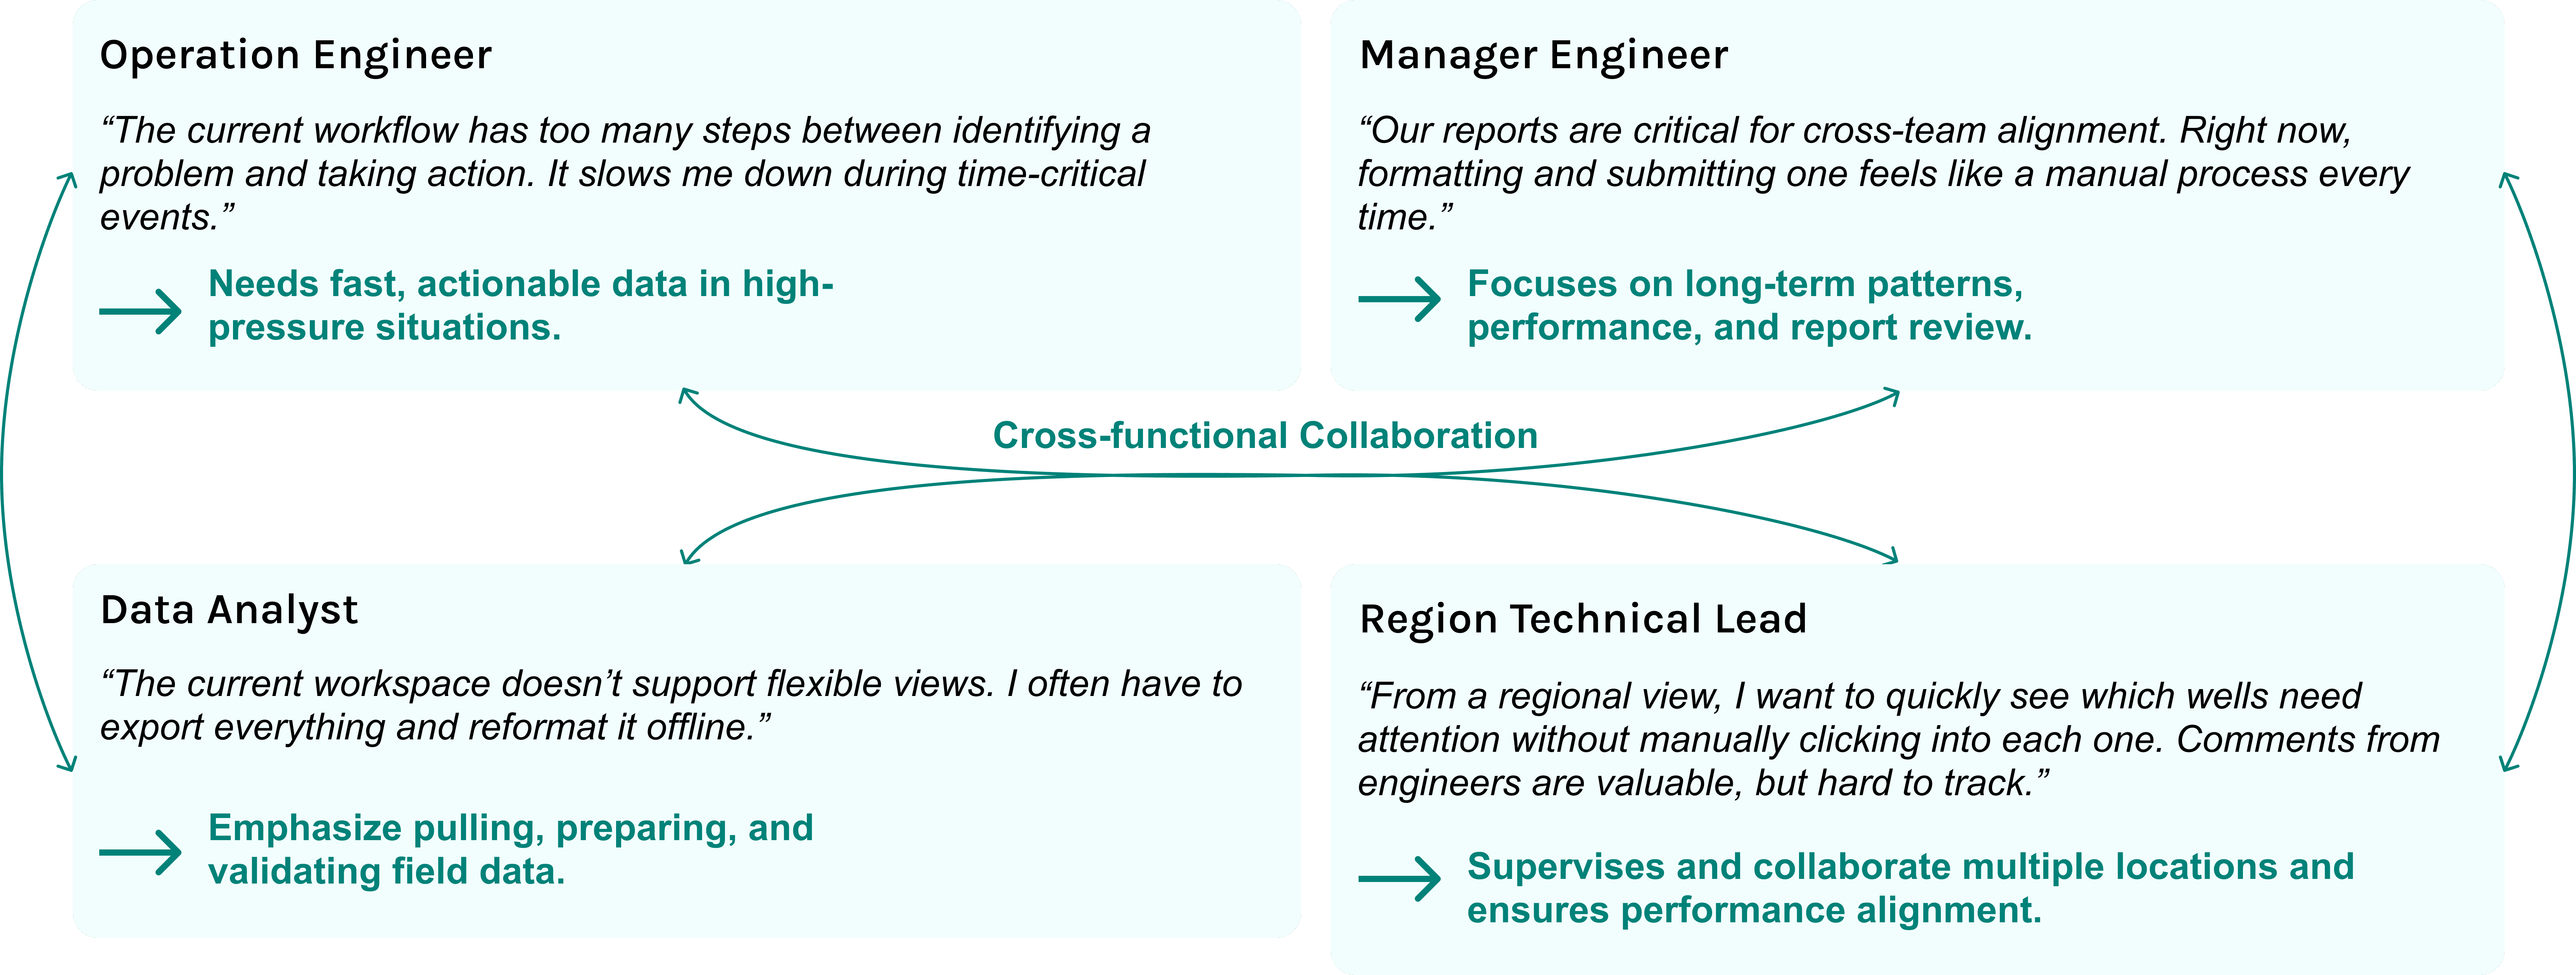
After conducting 12 stakeholder interviews across daily users of the system, including operation engineer, manager engineer, data analyst, and region technical lead, we found the most representative issues occurring in the current user experience and system, summarized as pain points:
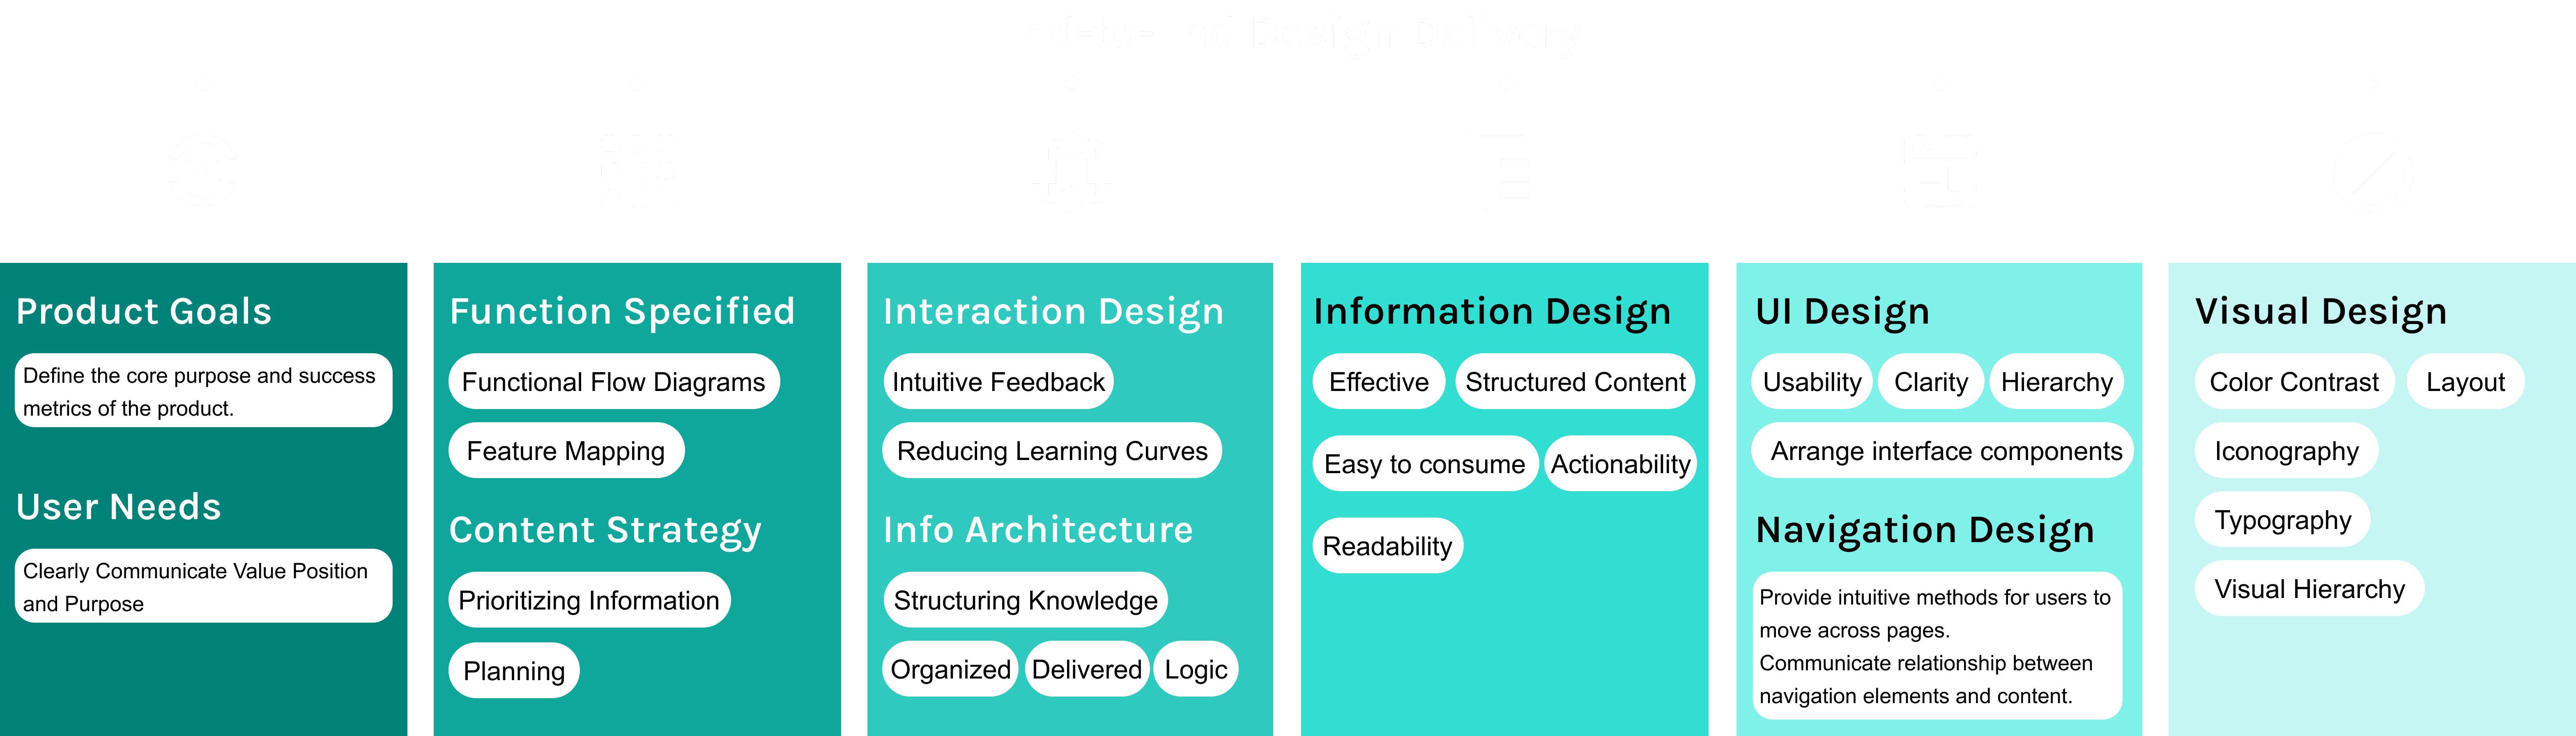
Design Strategy
After researching and analyzing the results, I planned an end-to-end design delivery with design opportunities to implement our solution.
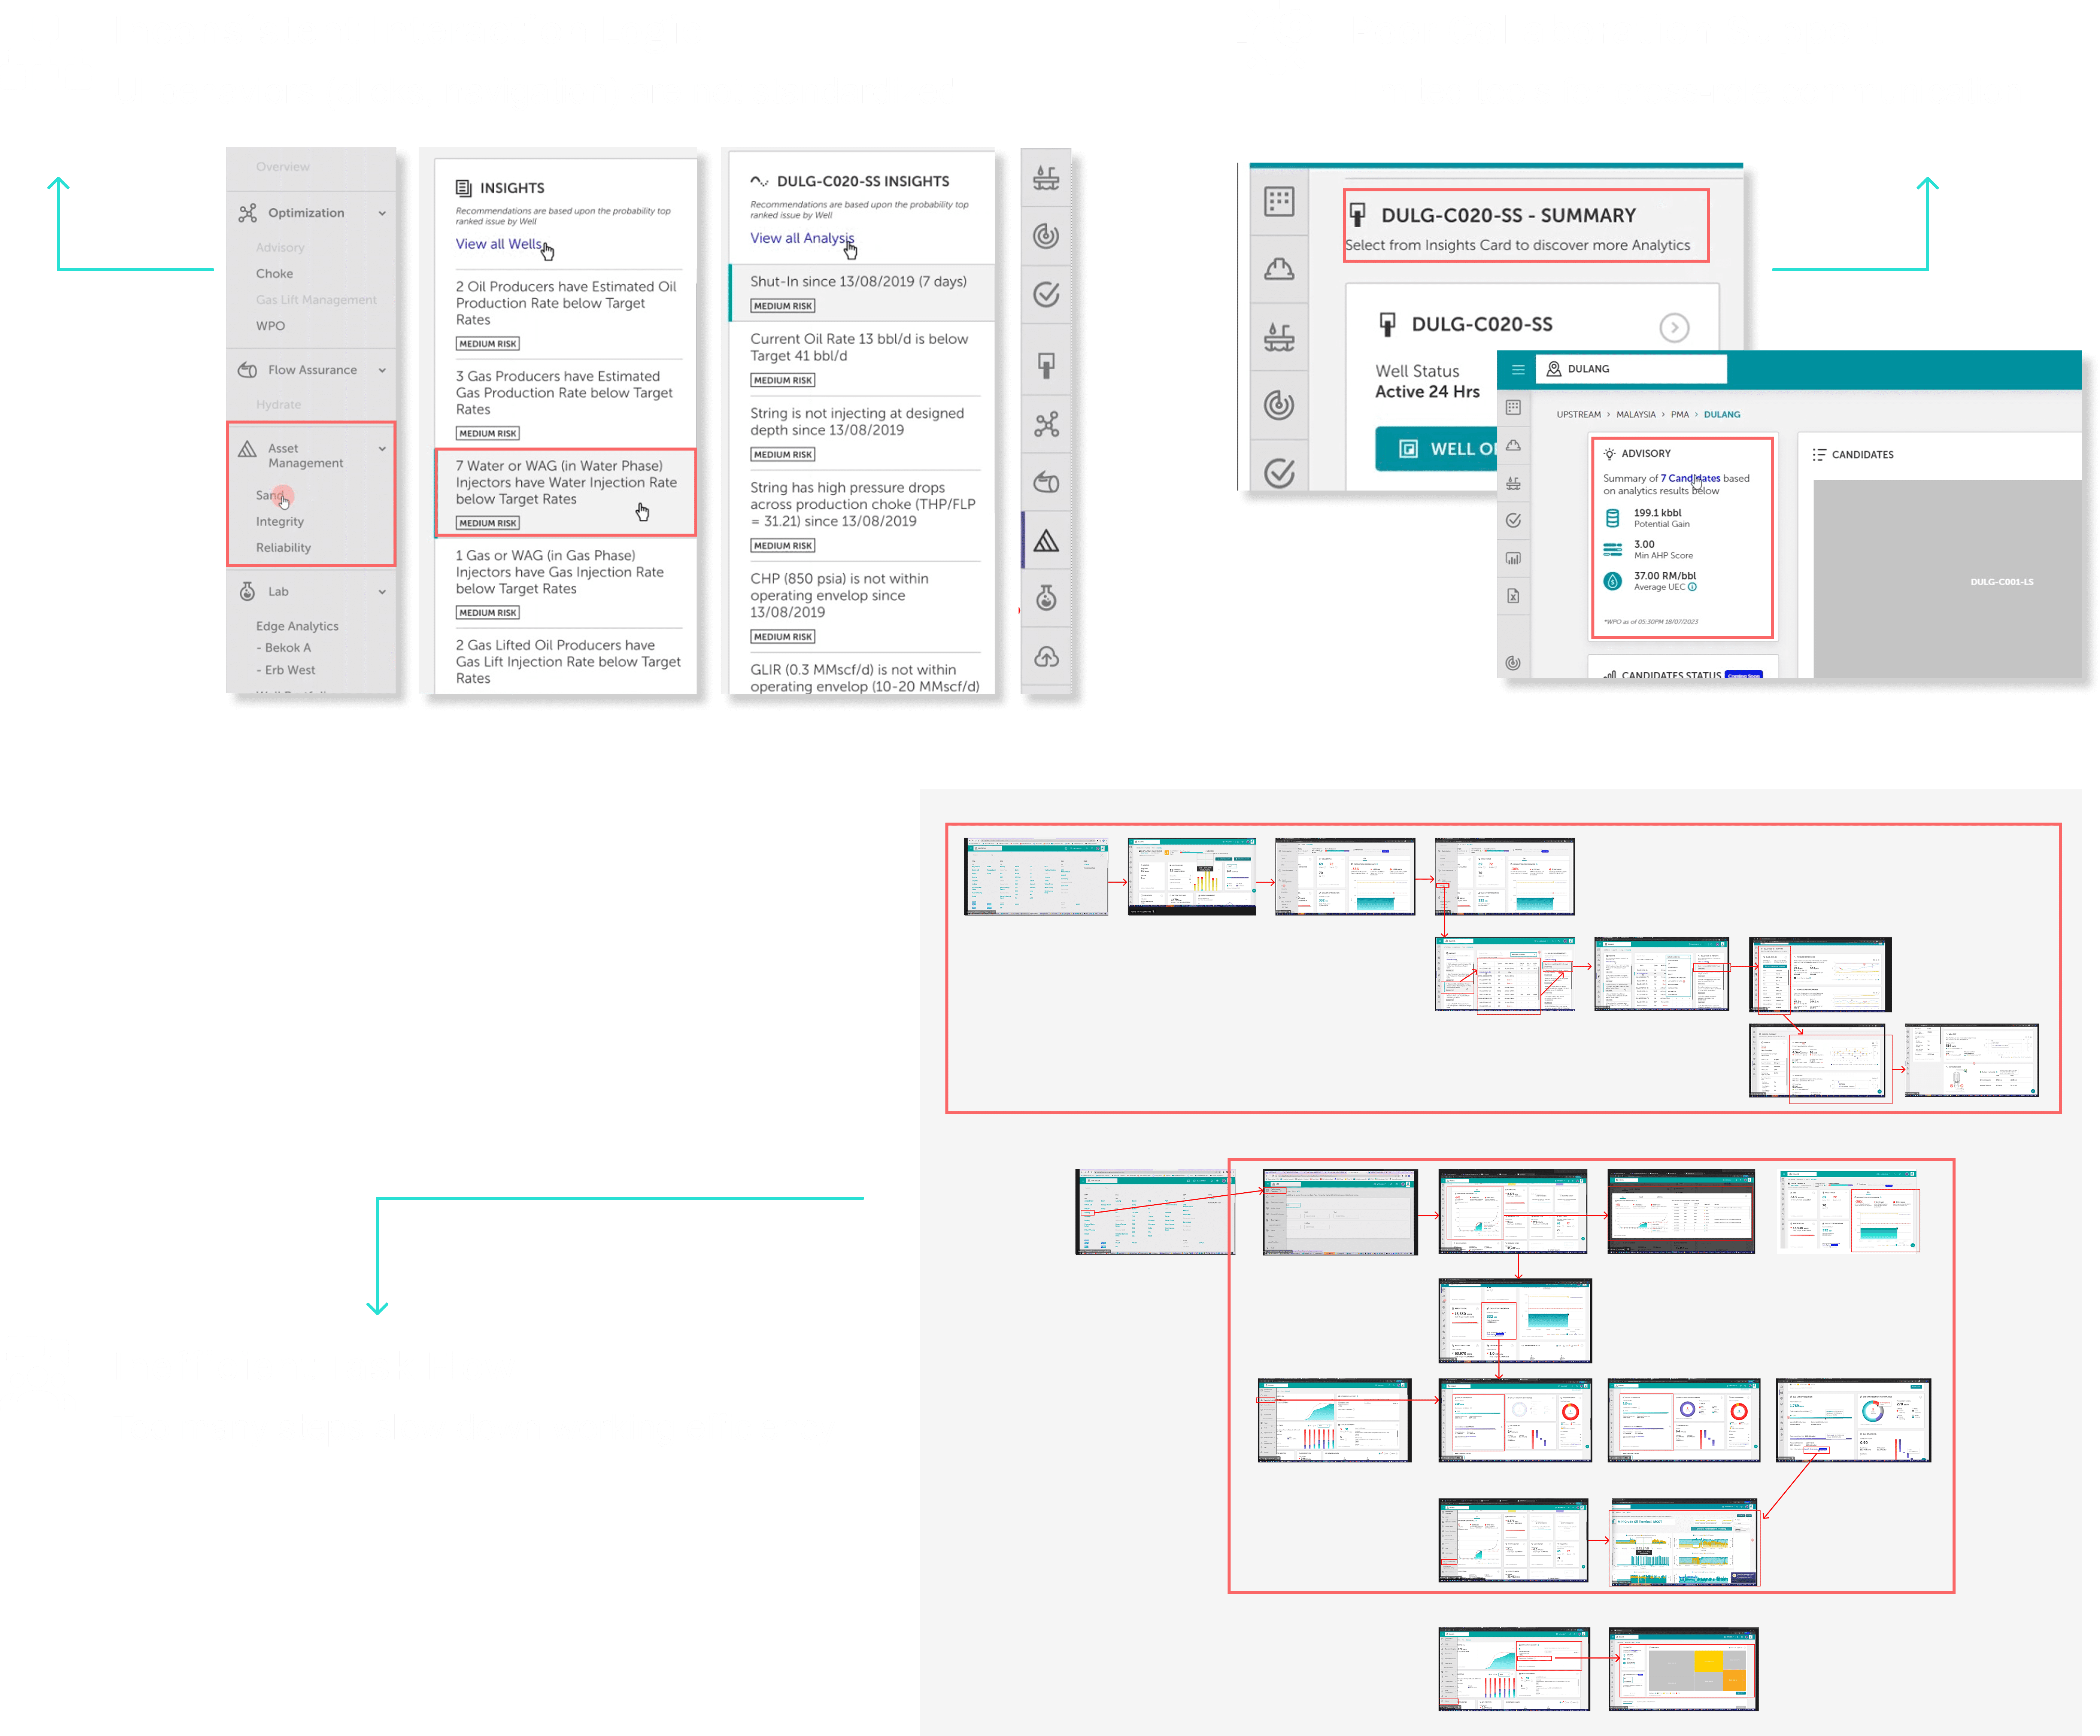
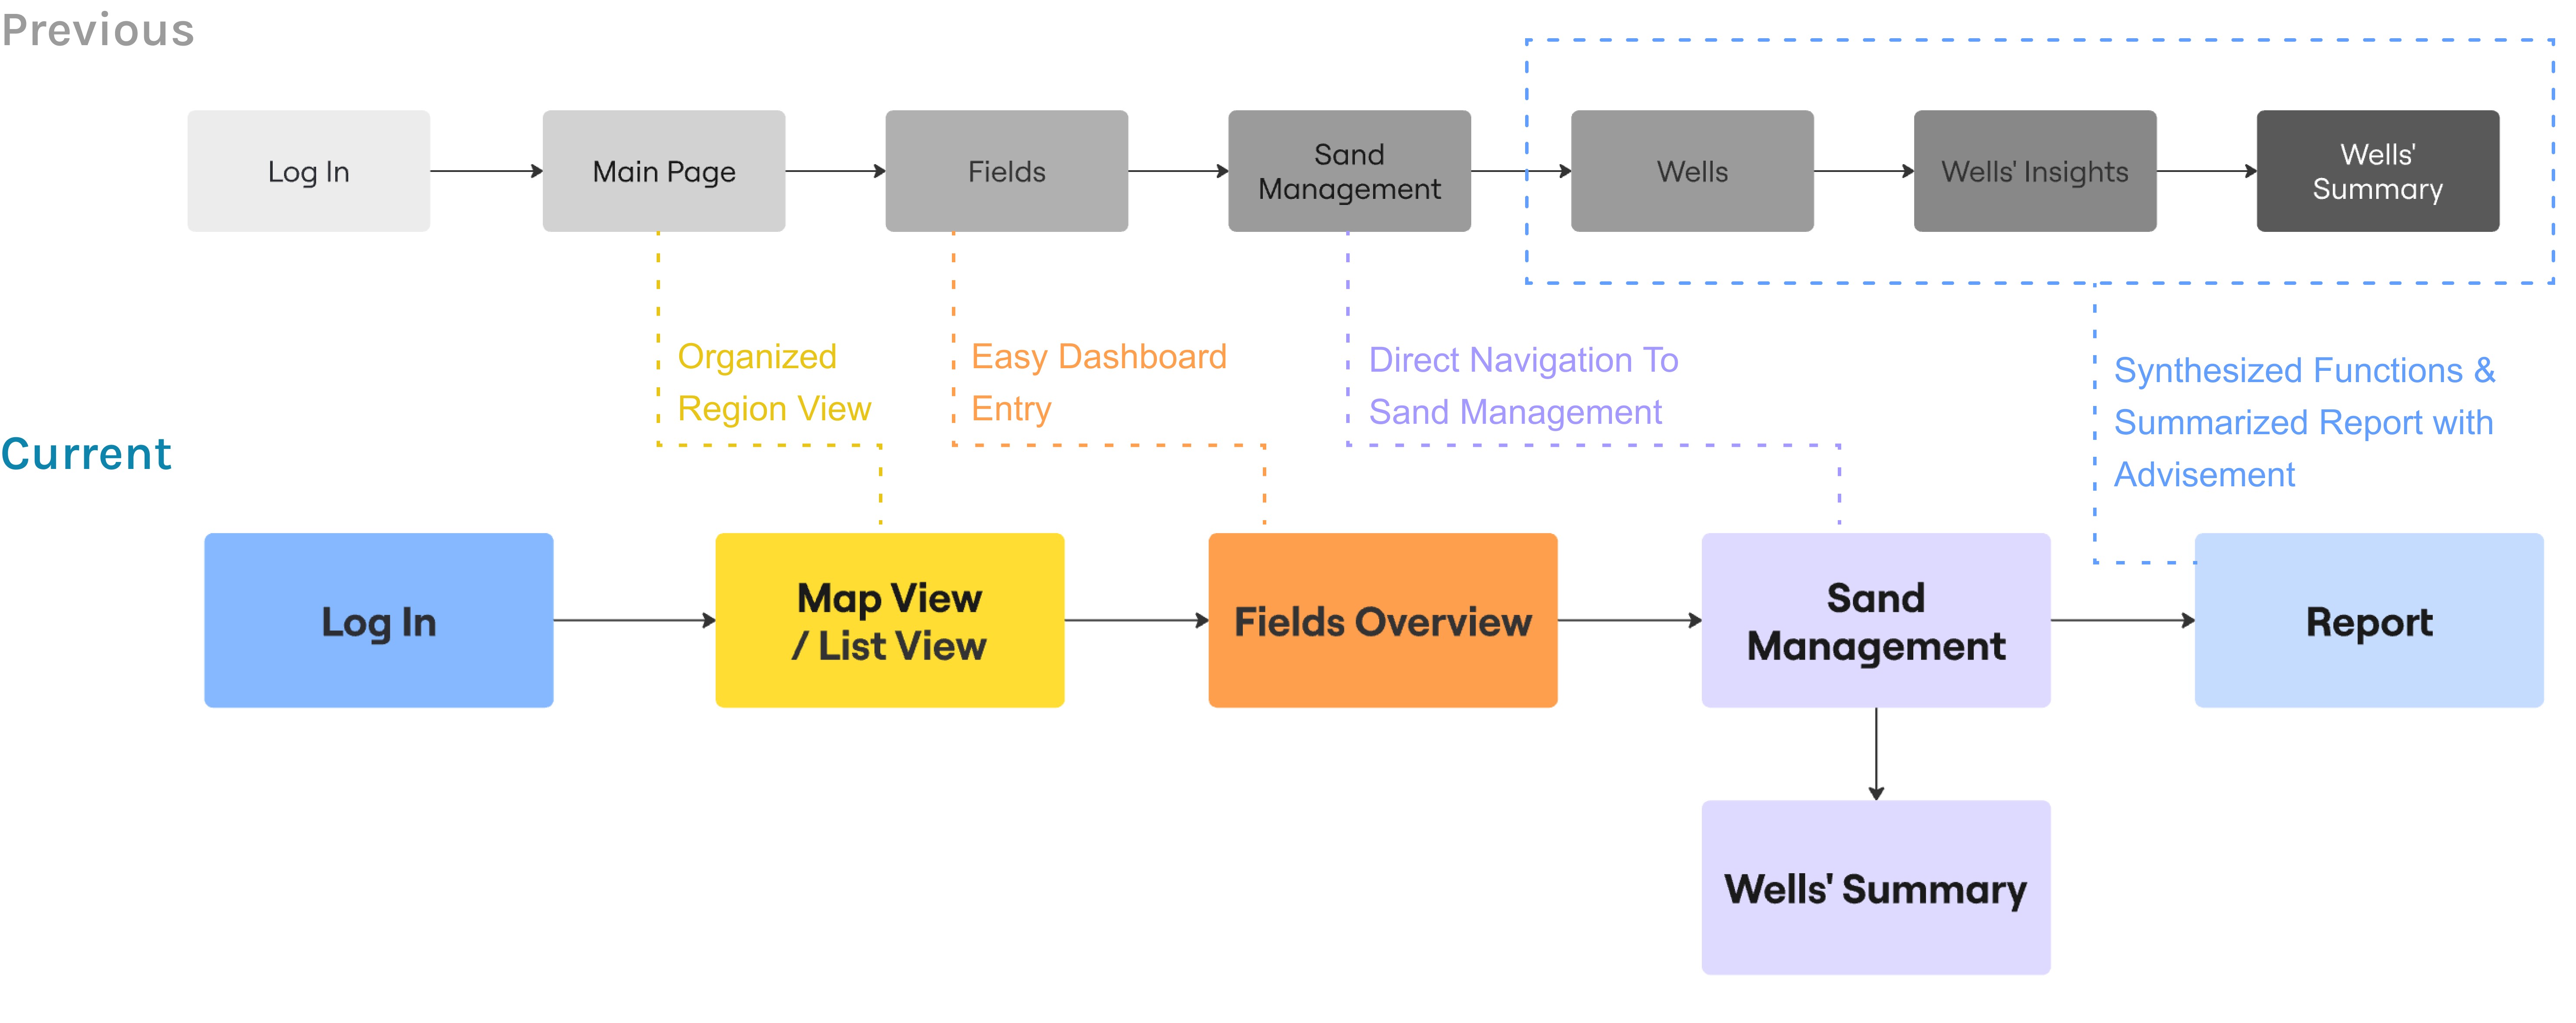
Workflow Simplification
I designed the new workflow for Sand Management and Production Optimization, simplifying and reducing 3 unnecessary steps to make an intuitive experience.
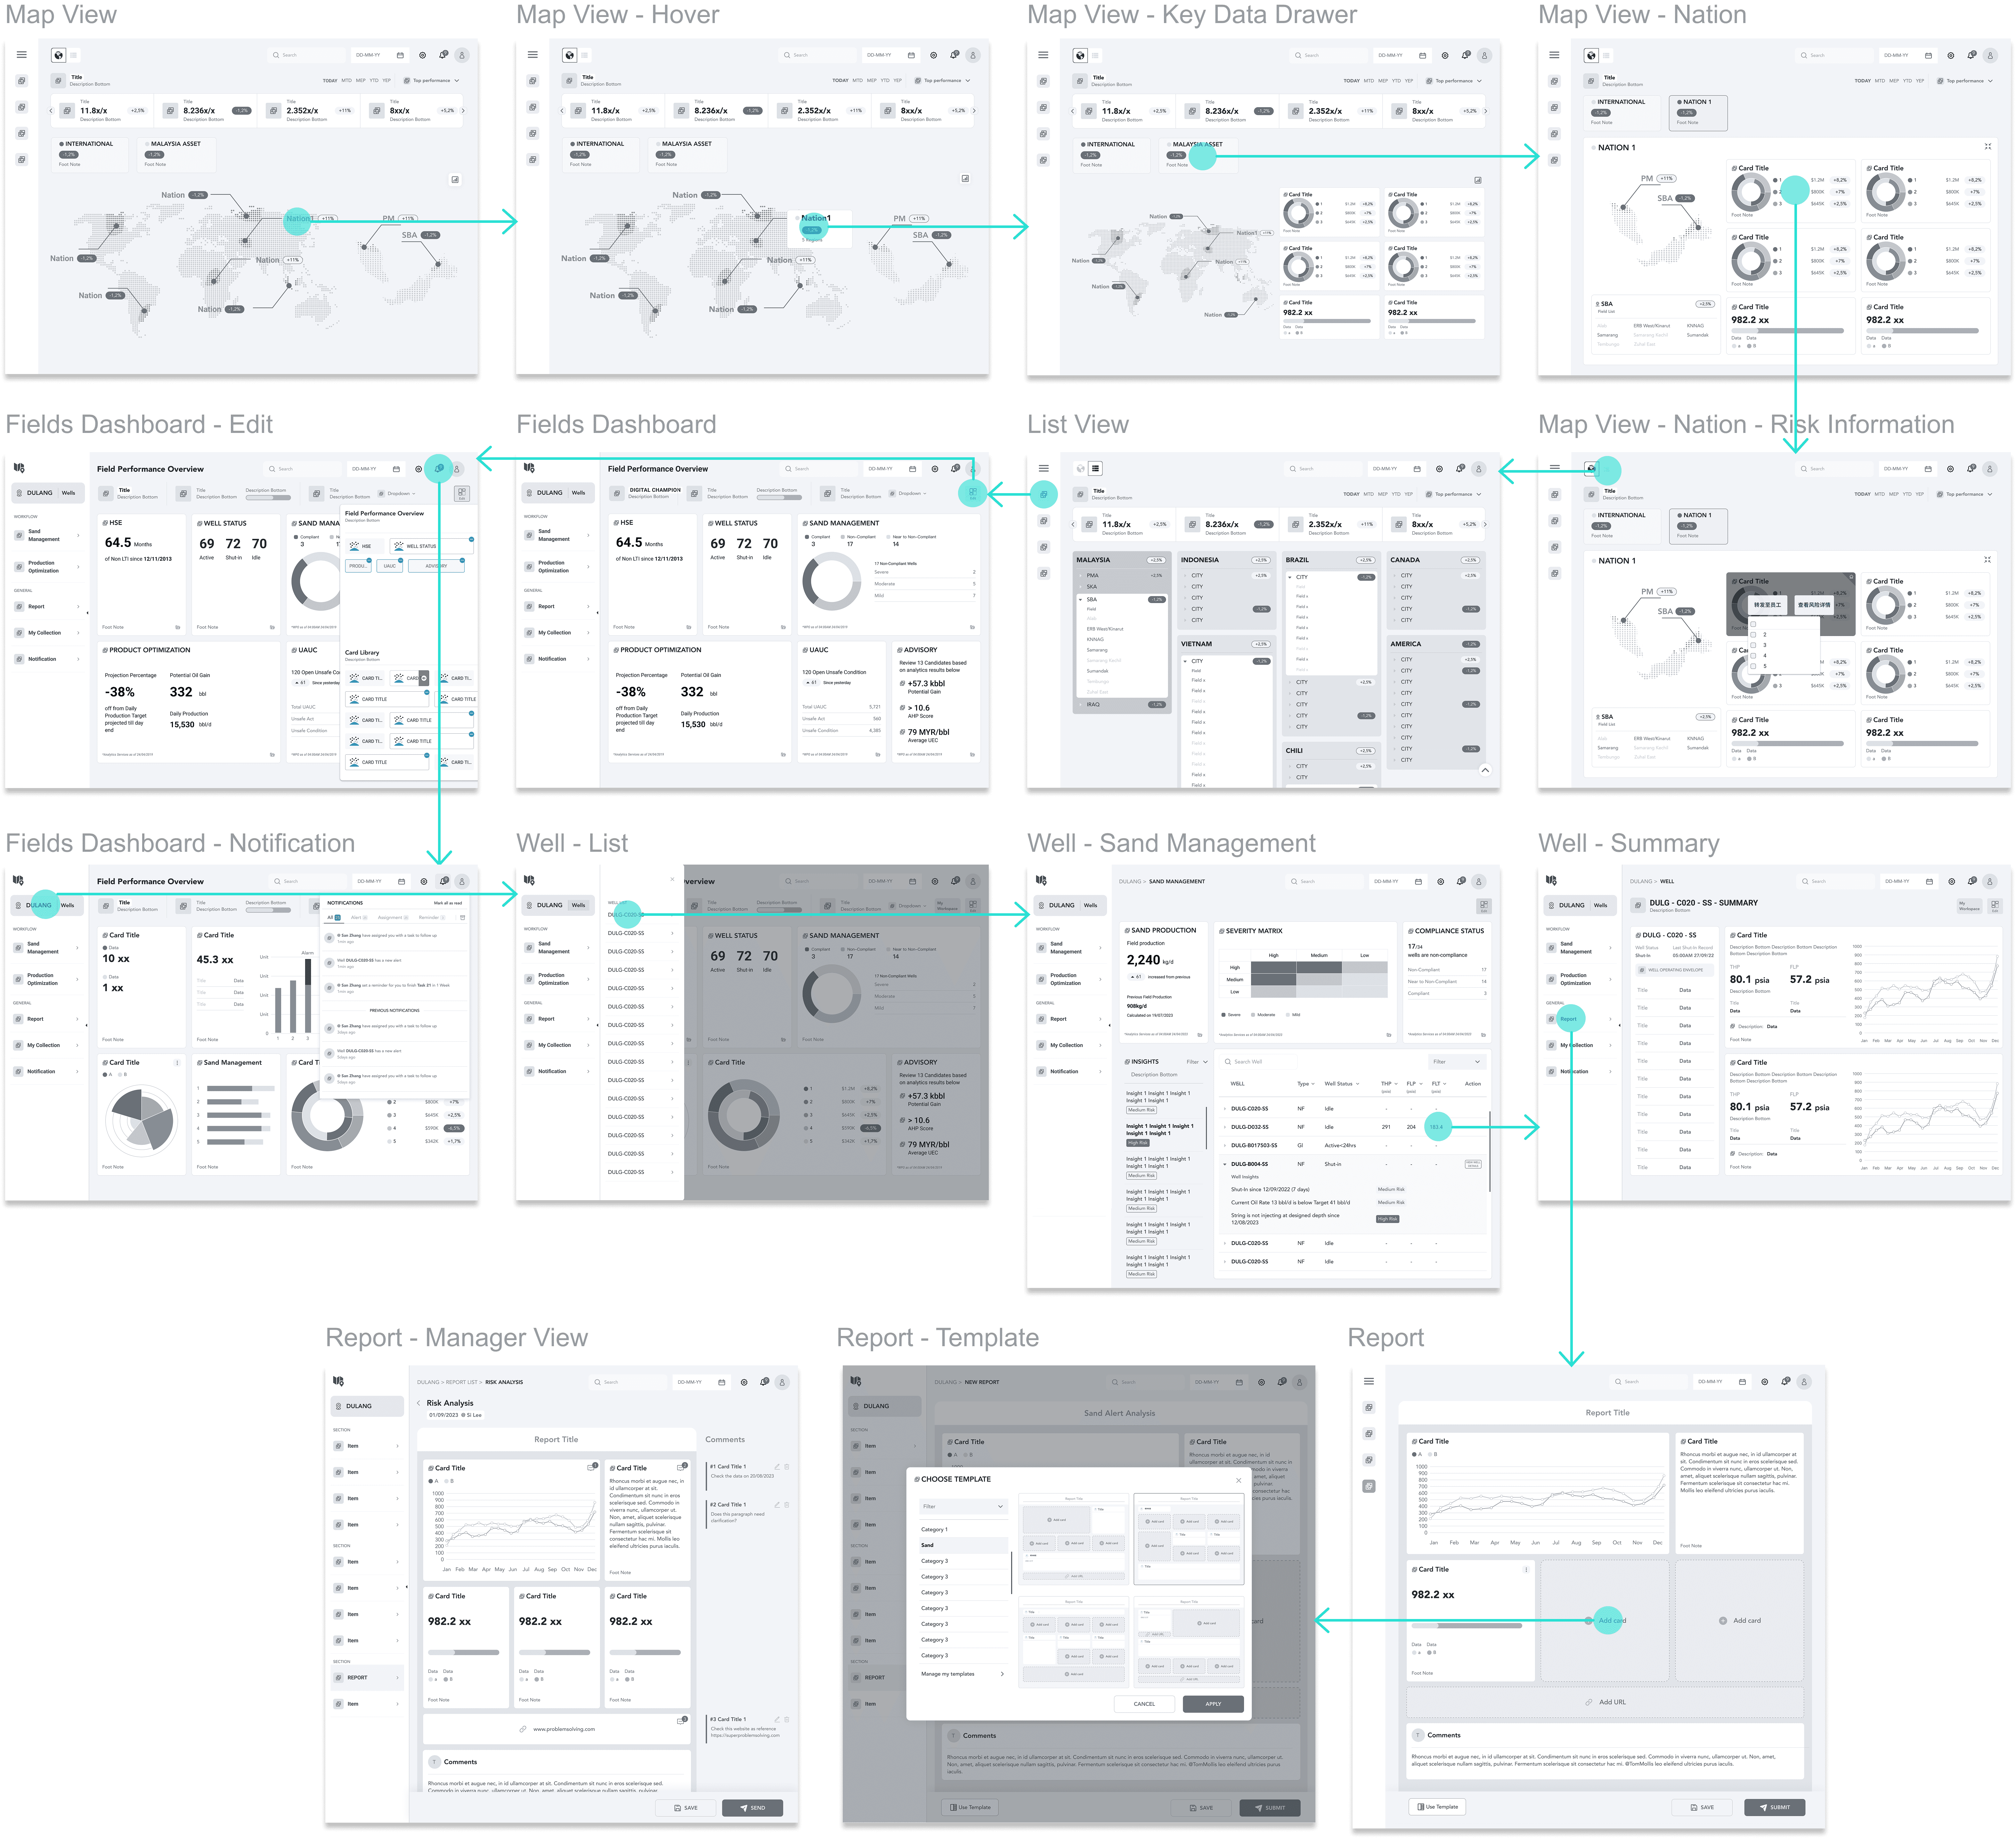
Workflow & Wireframing
We refined the workflow and implemented to wireframe new user interface.
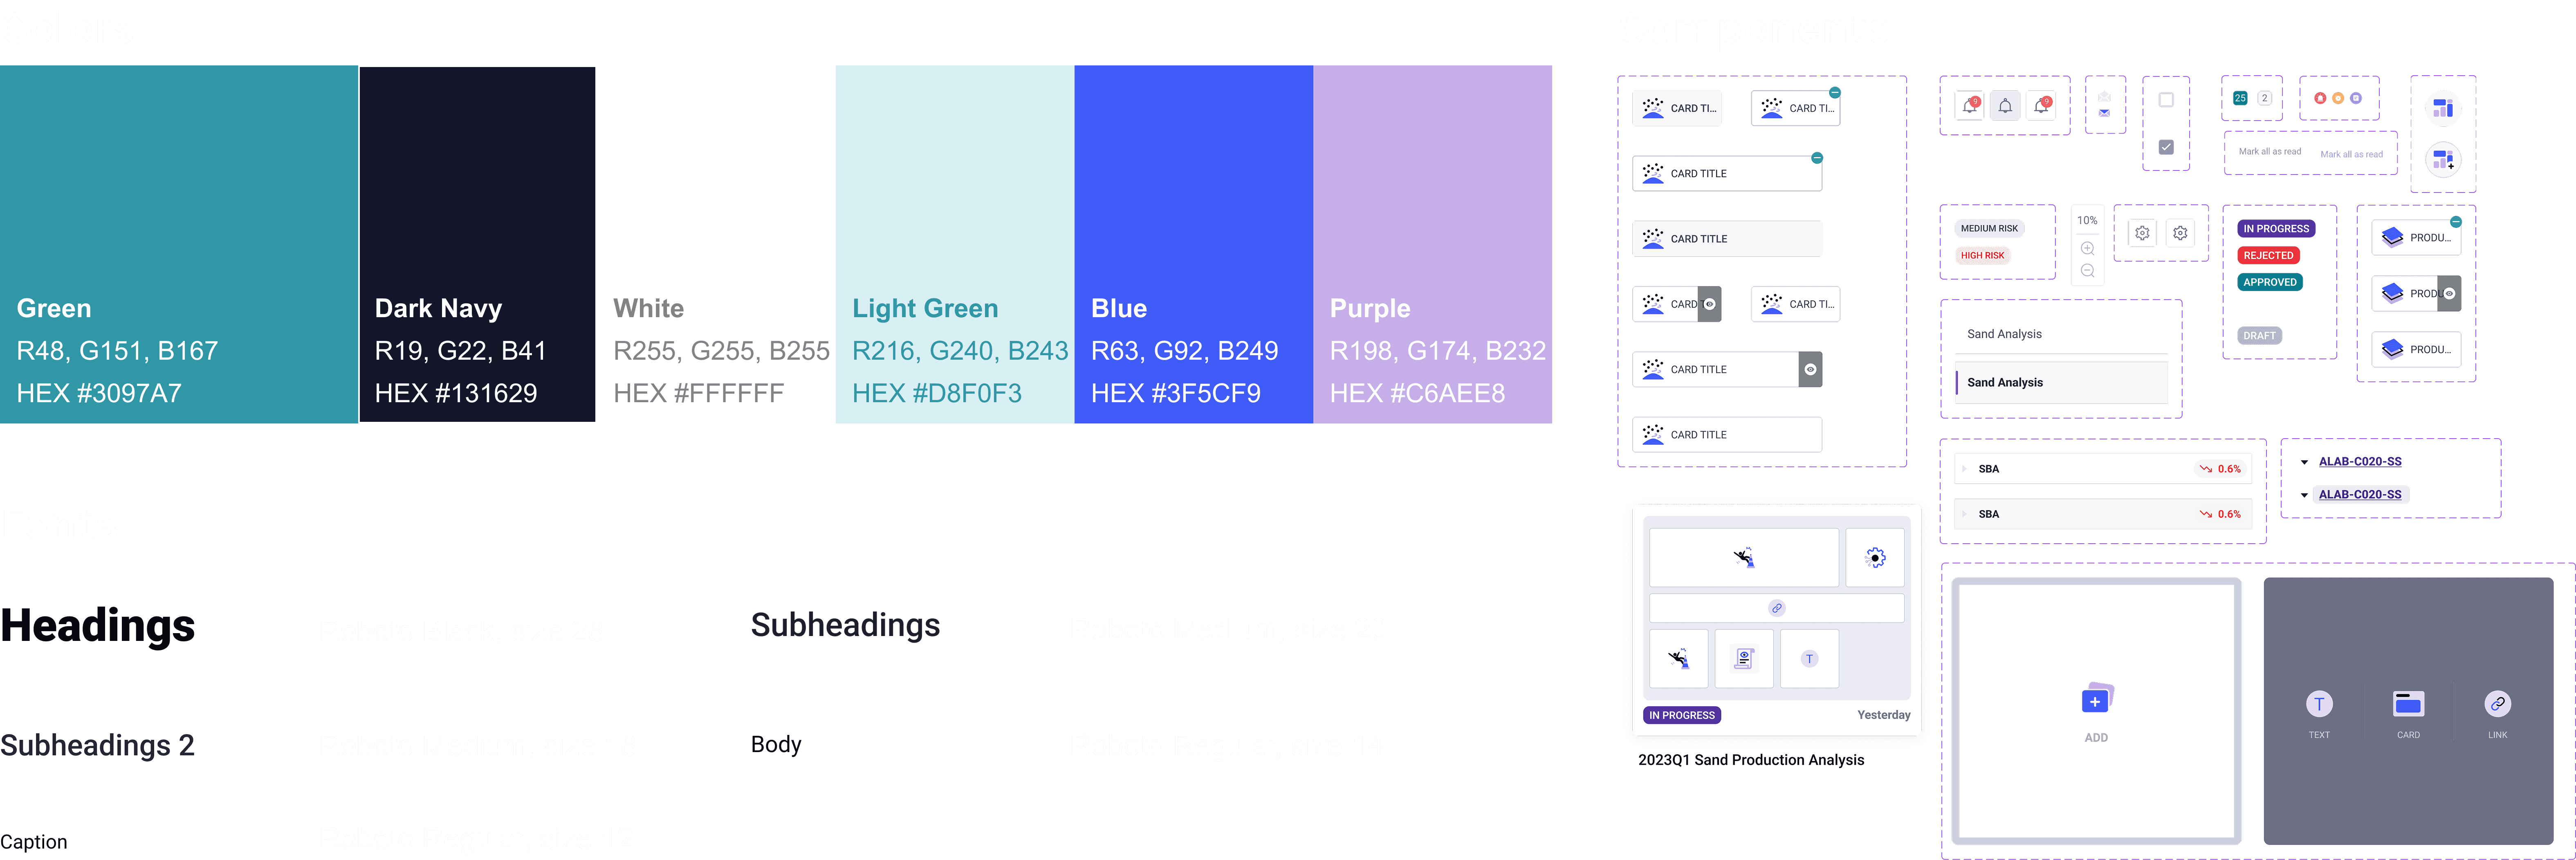
Design System
According to SLB's visual identity, I designed the new series of icons with corresponding colors and a set of reusable components for interface.
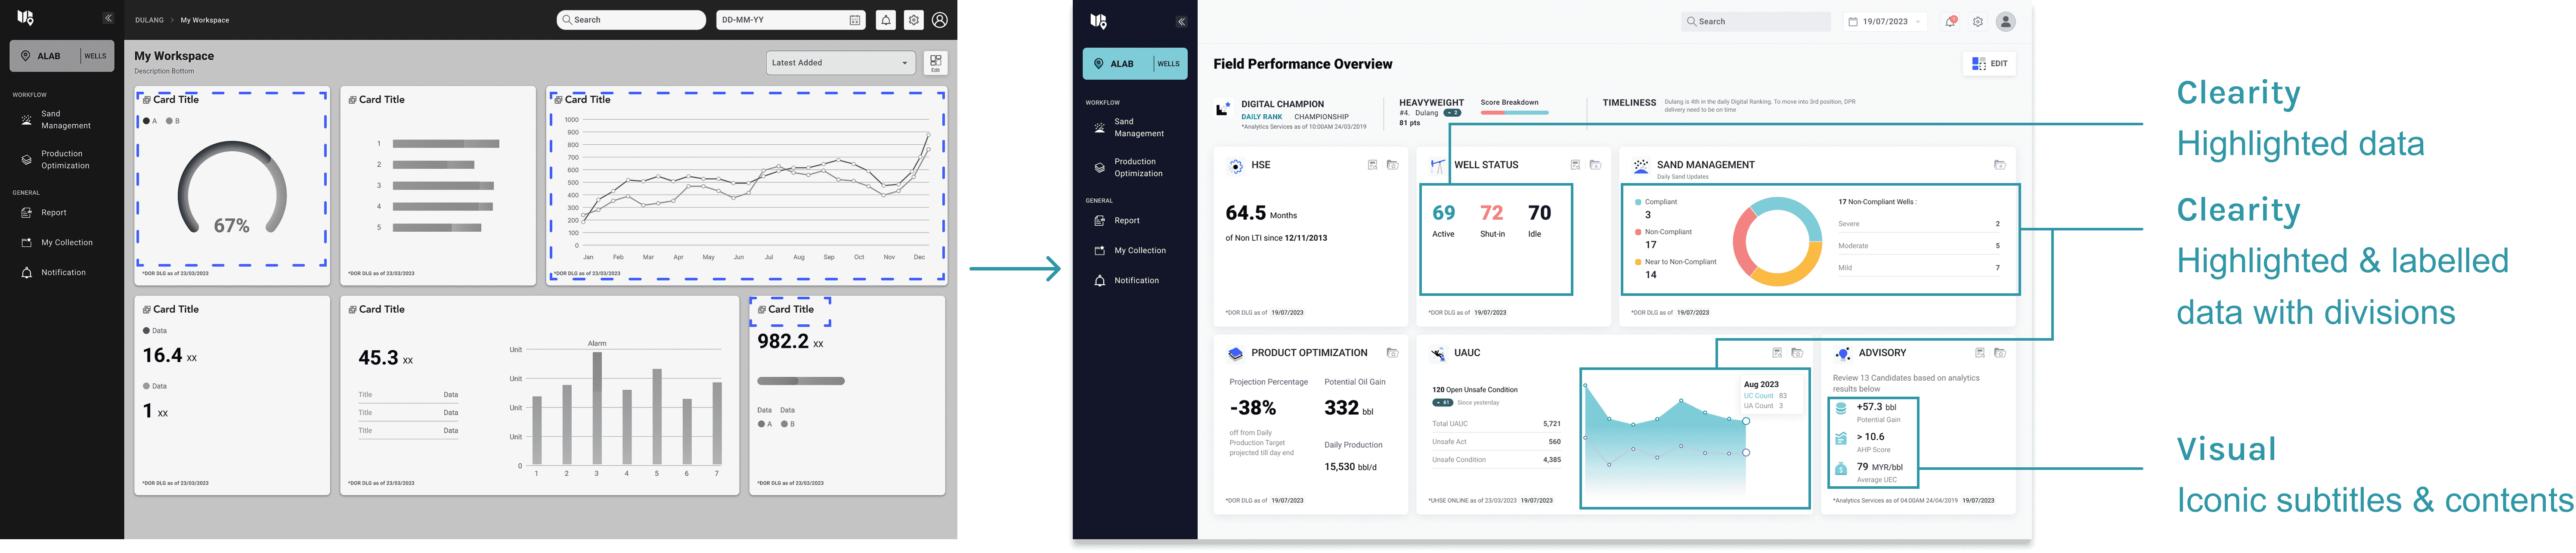
Iterations
Based on usability tests with 8 users, we iterated low-fidelity wireframes to mid-fidelity, solving the problems of overlapping, inconsistency, confusion, low readability, and redundency.
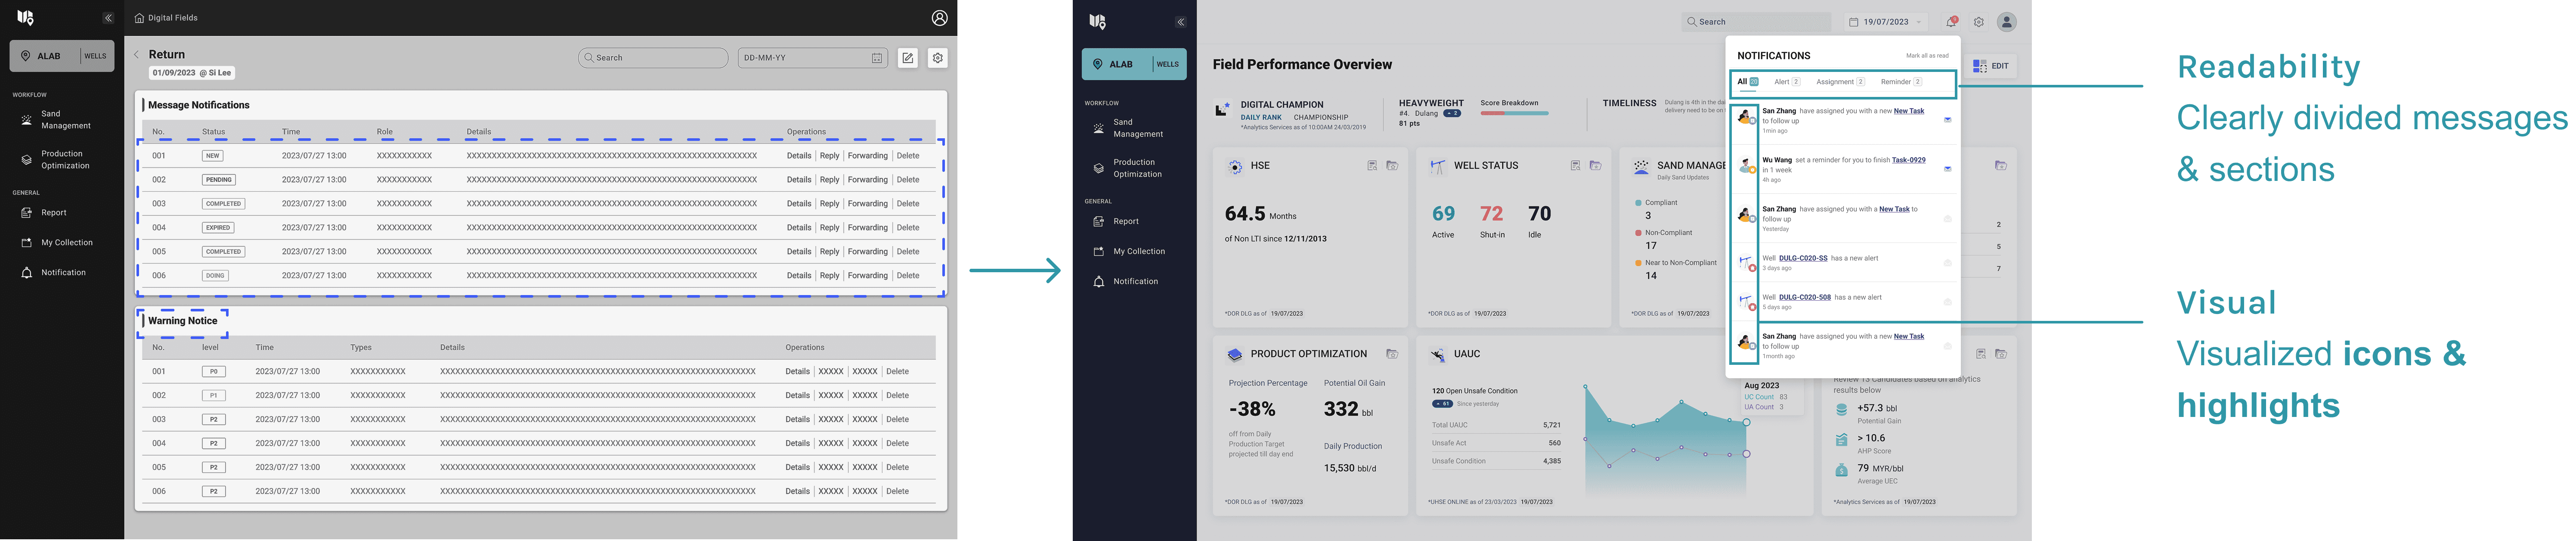
Field Performance Overview
Notification
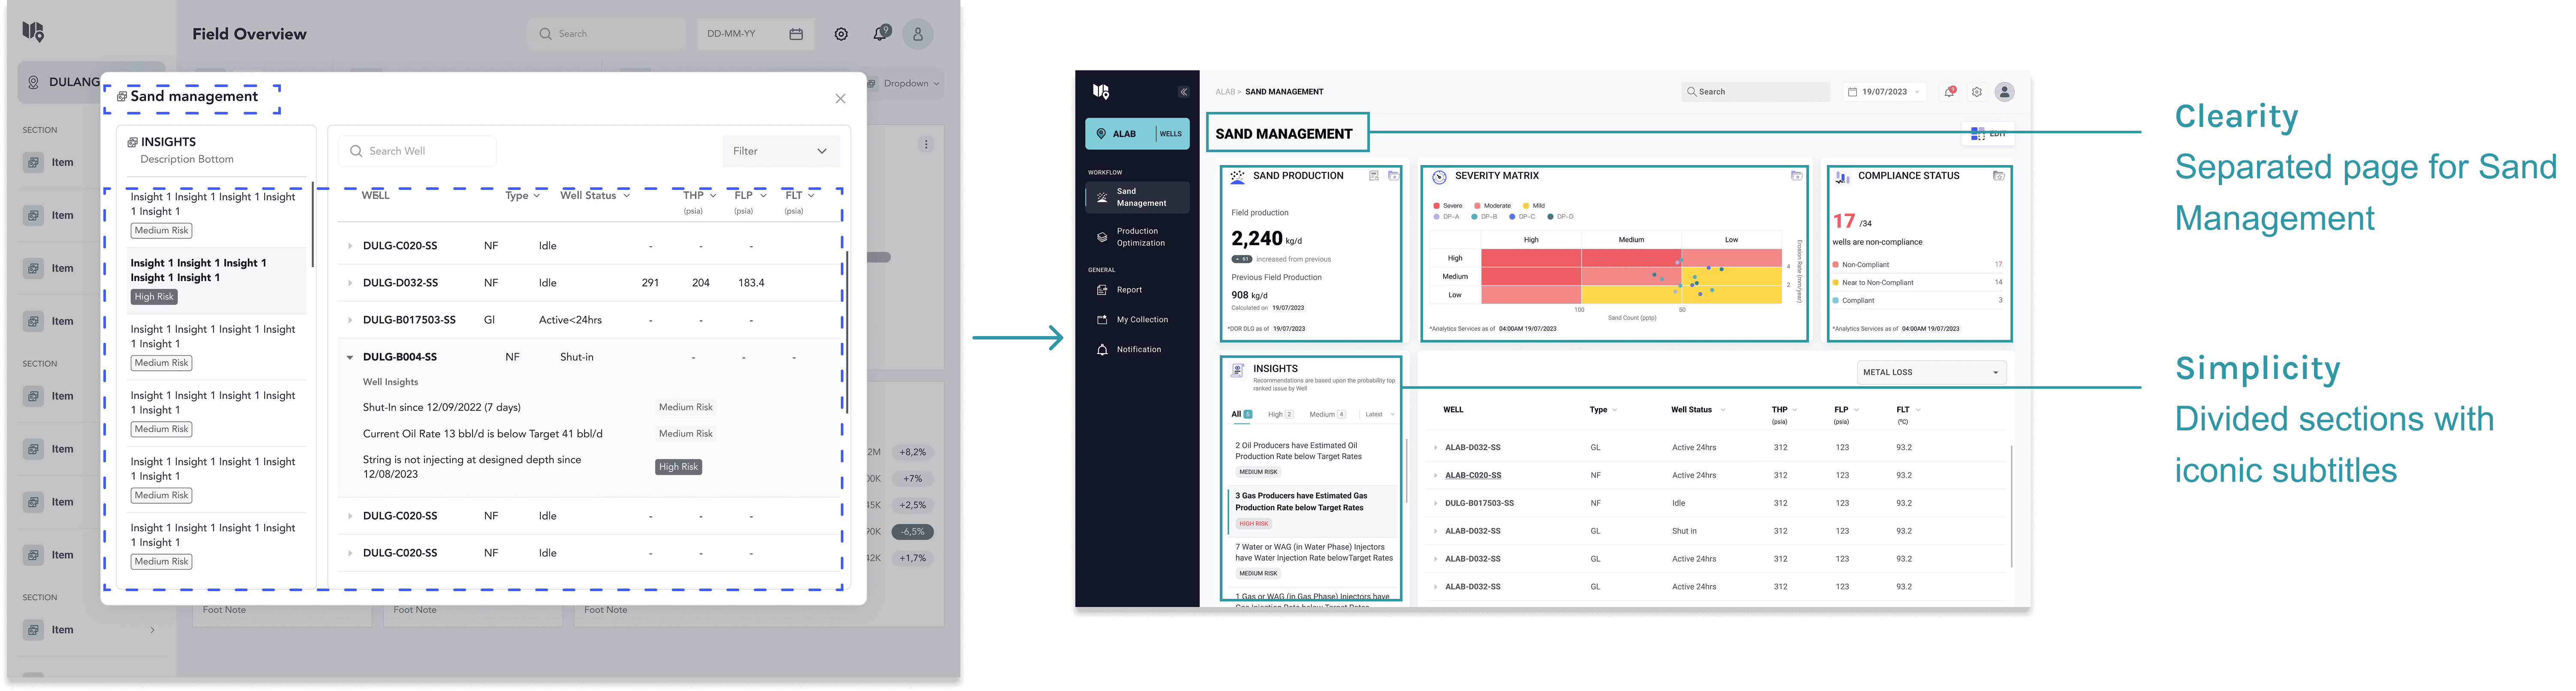
Sand Management
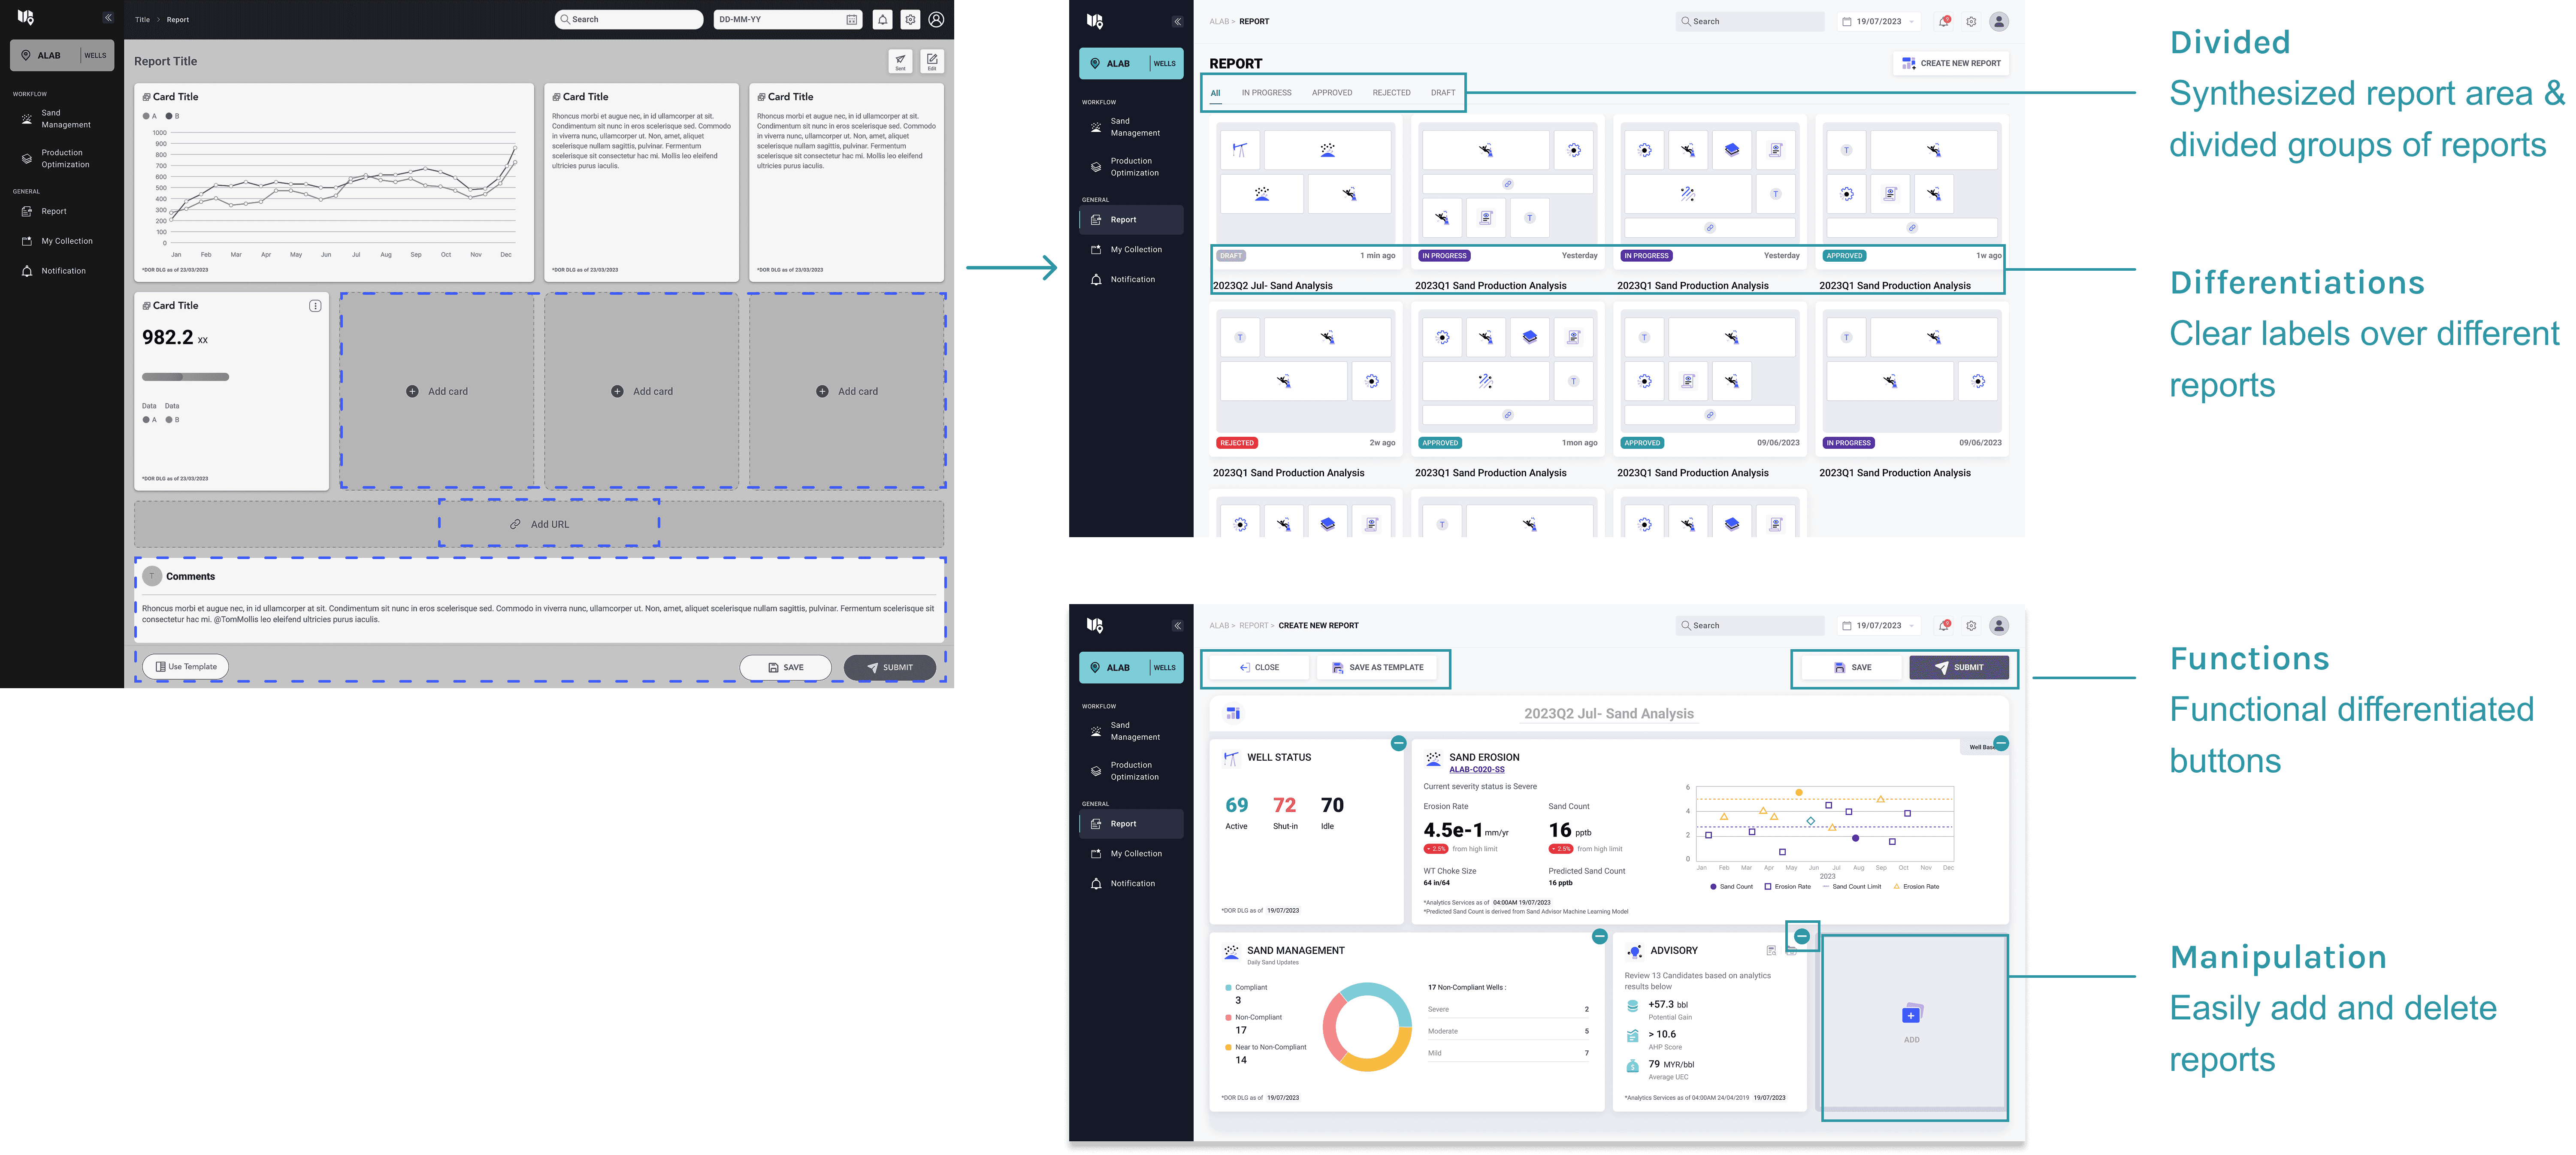
Report
01

02

03

